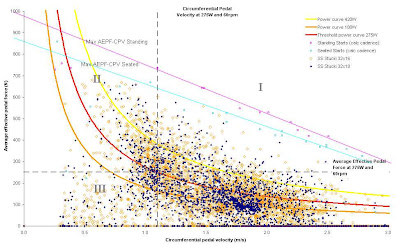
A few weeks back I posted a this QA scatter plot. I'd been riding the SS about 2-3 weeks at this point.

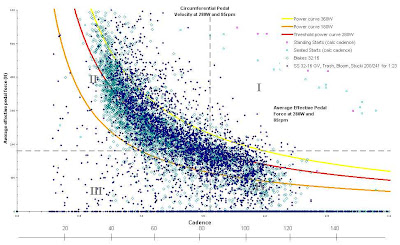
Here's the latest. Both rides were on the 2:1. The "Blakes" data is from a ~ 2500' climb with sustained grades well over 10% while the other ride was just rippin around faster singletrack with a grin.

See any differences? The legs are changing. Here's what I see in QA:
- the left "edge" of the data points in the first file is at a cadence of about 50 while it's upper 30's in the second.
- there are no cadence/force "holes" in the data.
- power is up despite no structured training. Free power? Yea baby!
- somewhat hidden in the second file...but there are several points popping up above the max AEPF/CPV line established by the standing start testing - this means max force at low cadence is increasing.
Note to Ed: see how the points on that left edge start to go straight up? That's where it's getting really tough to maintain that minimal cadence and I'll go as hard as I have to to maintain it. To hold a given power, force has to rise rapidly at low cadences, and that's the physics part I was tallking about in the comments. It's power that gets us up a hill, not force. Dangit.
I promise at some point there will be non-technical backway meanderings again...there would be today if I'd have had a camera yesterday!!! Big rain event and mountain snowfall, flash floods rising 30 feet over bridges in slot canyons...just picture that in the most scenic spot on earth and you'd have the picture :)